
Forex Charting Platform: 3 Chart Types, Unlimited Layouts
Most platforms give you one chart and call it a day. Prime Terminal is a forex charting platform built differently: 3 separate chart widgets, each designed for a specific job, arranged in any layout you want across as many panels as you want. This article breaks down what each chart does, when to use which one, and how to build a charting desk that actually fits the way you trade.
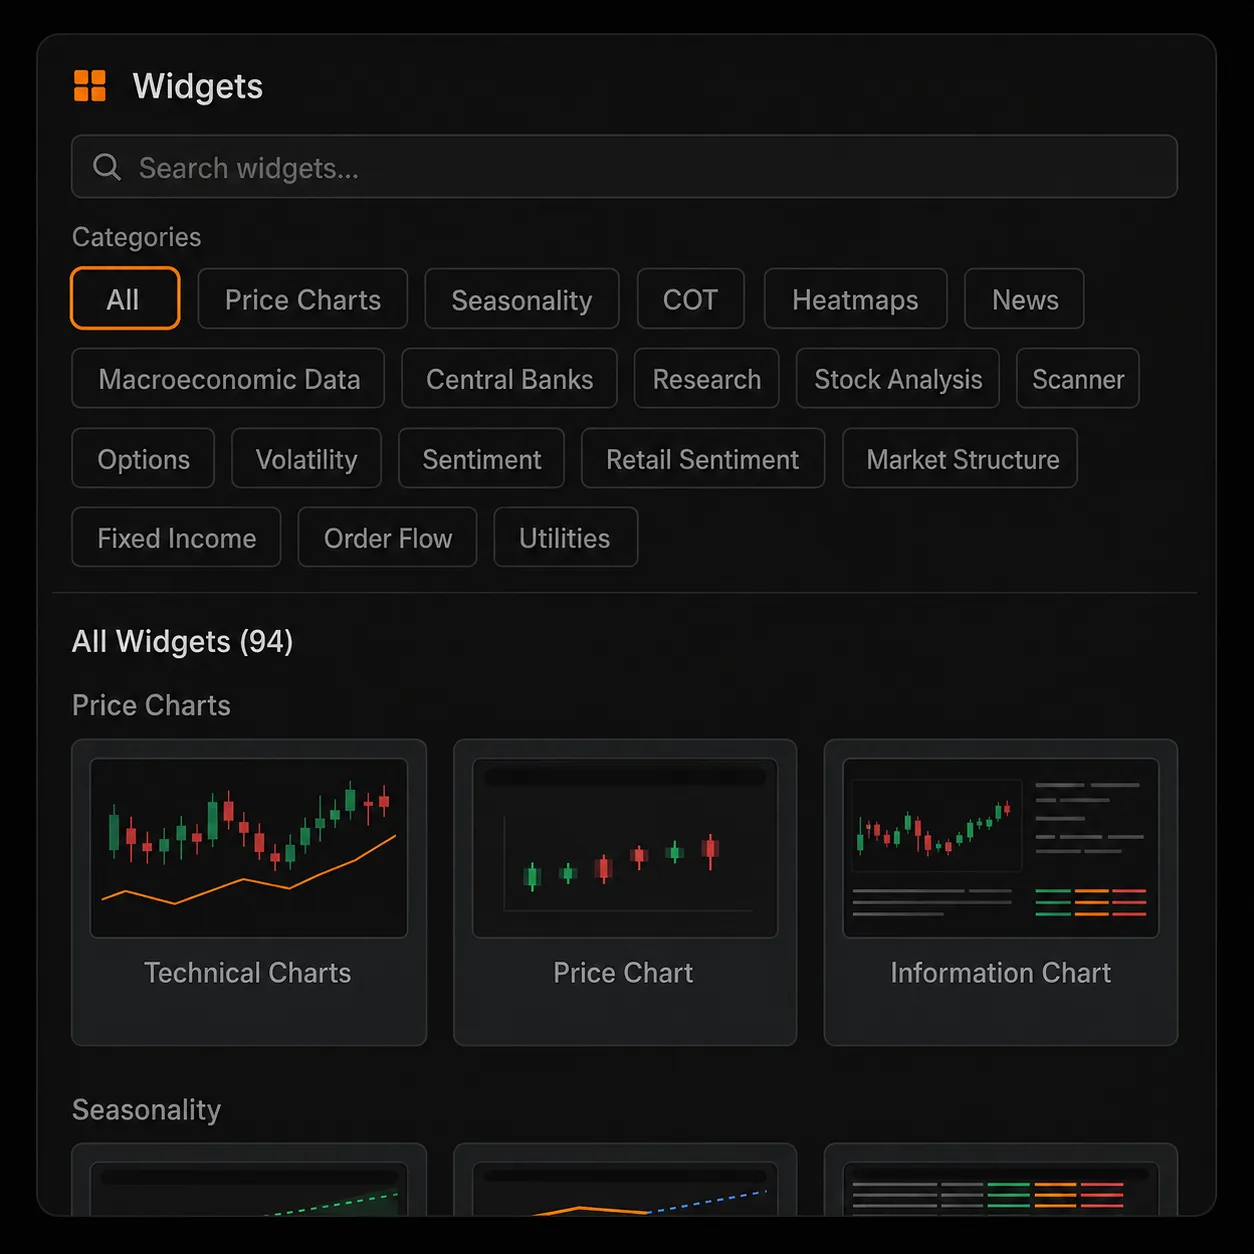
Prime Terminal includes over 90 widgets covering news, macro data, positioning, sentiment and institutional research. The Price Charts category is where most traders start, because everything else in the terminal eventually comes back to one question: what is price actually doing?
The 3 Chart Types in Prime Terminal
Inside the widget menu you will find 3 chart widgets under Price Charts:
- Technical Charts for full technical analysis
- Price Chart for a fast, clean view of price action
- Information Chart for price combined with live market context
They look similar at first glance. They are not. Each one is optimized for a specific way of working.
Technical Charts: The Full Analysis Workstation
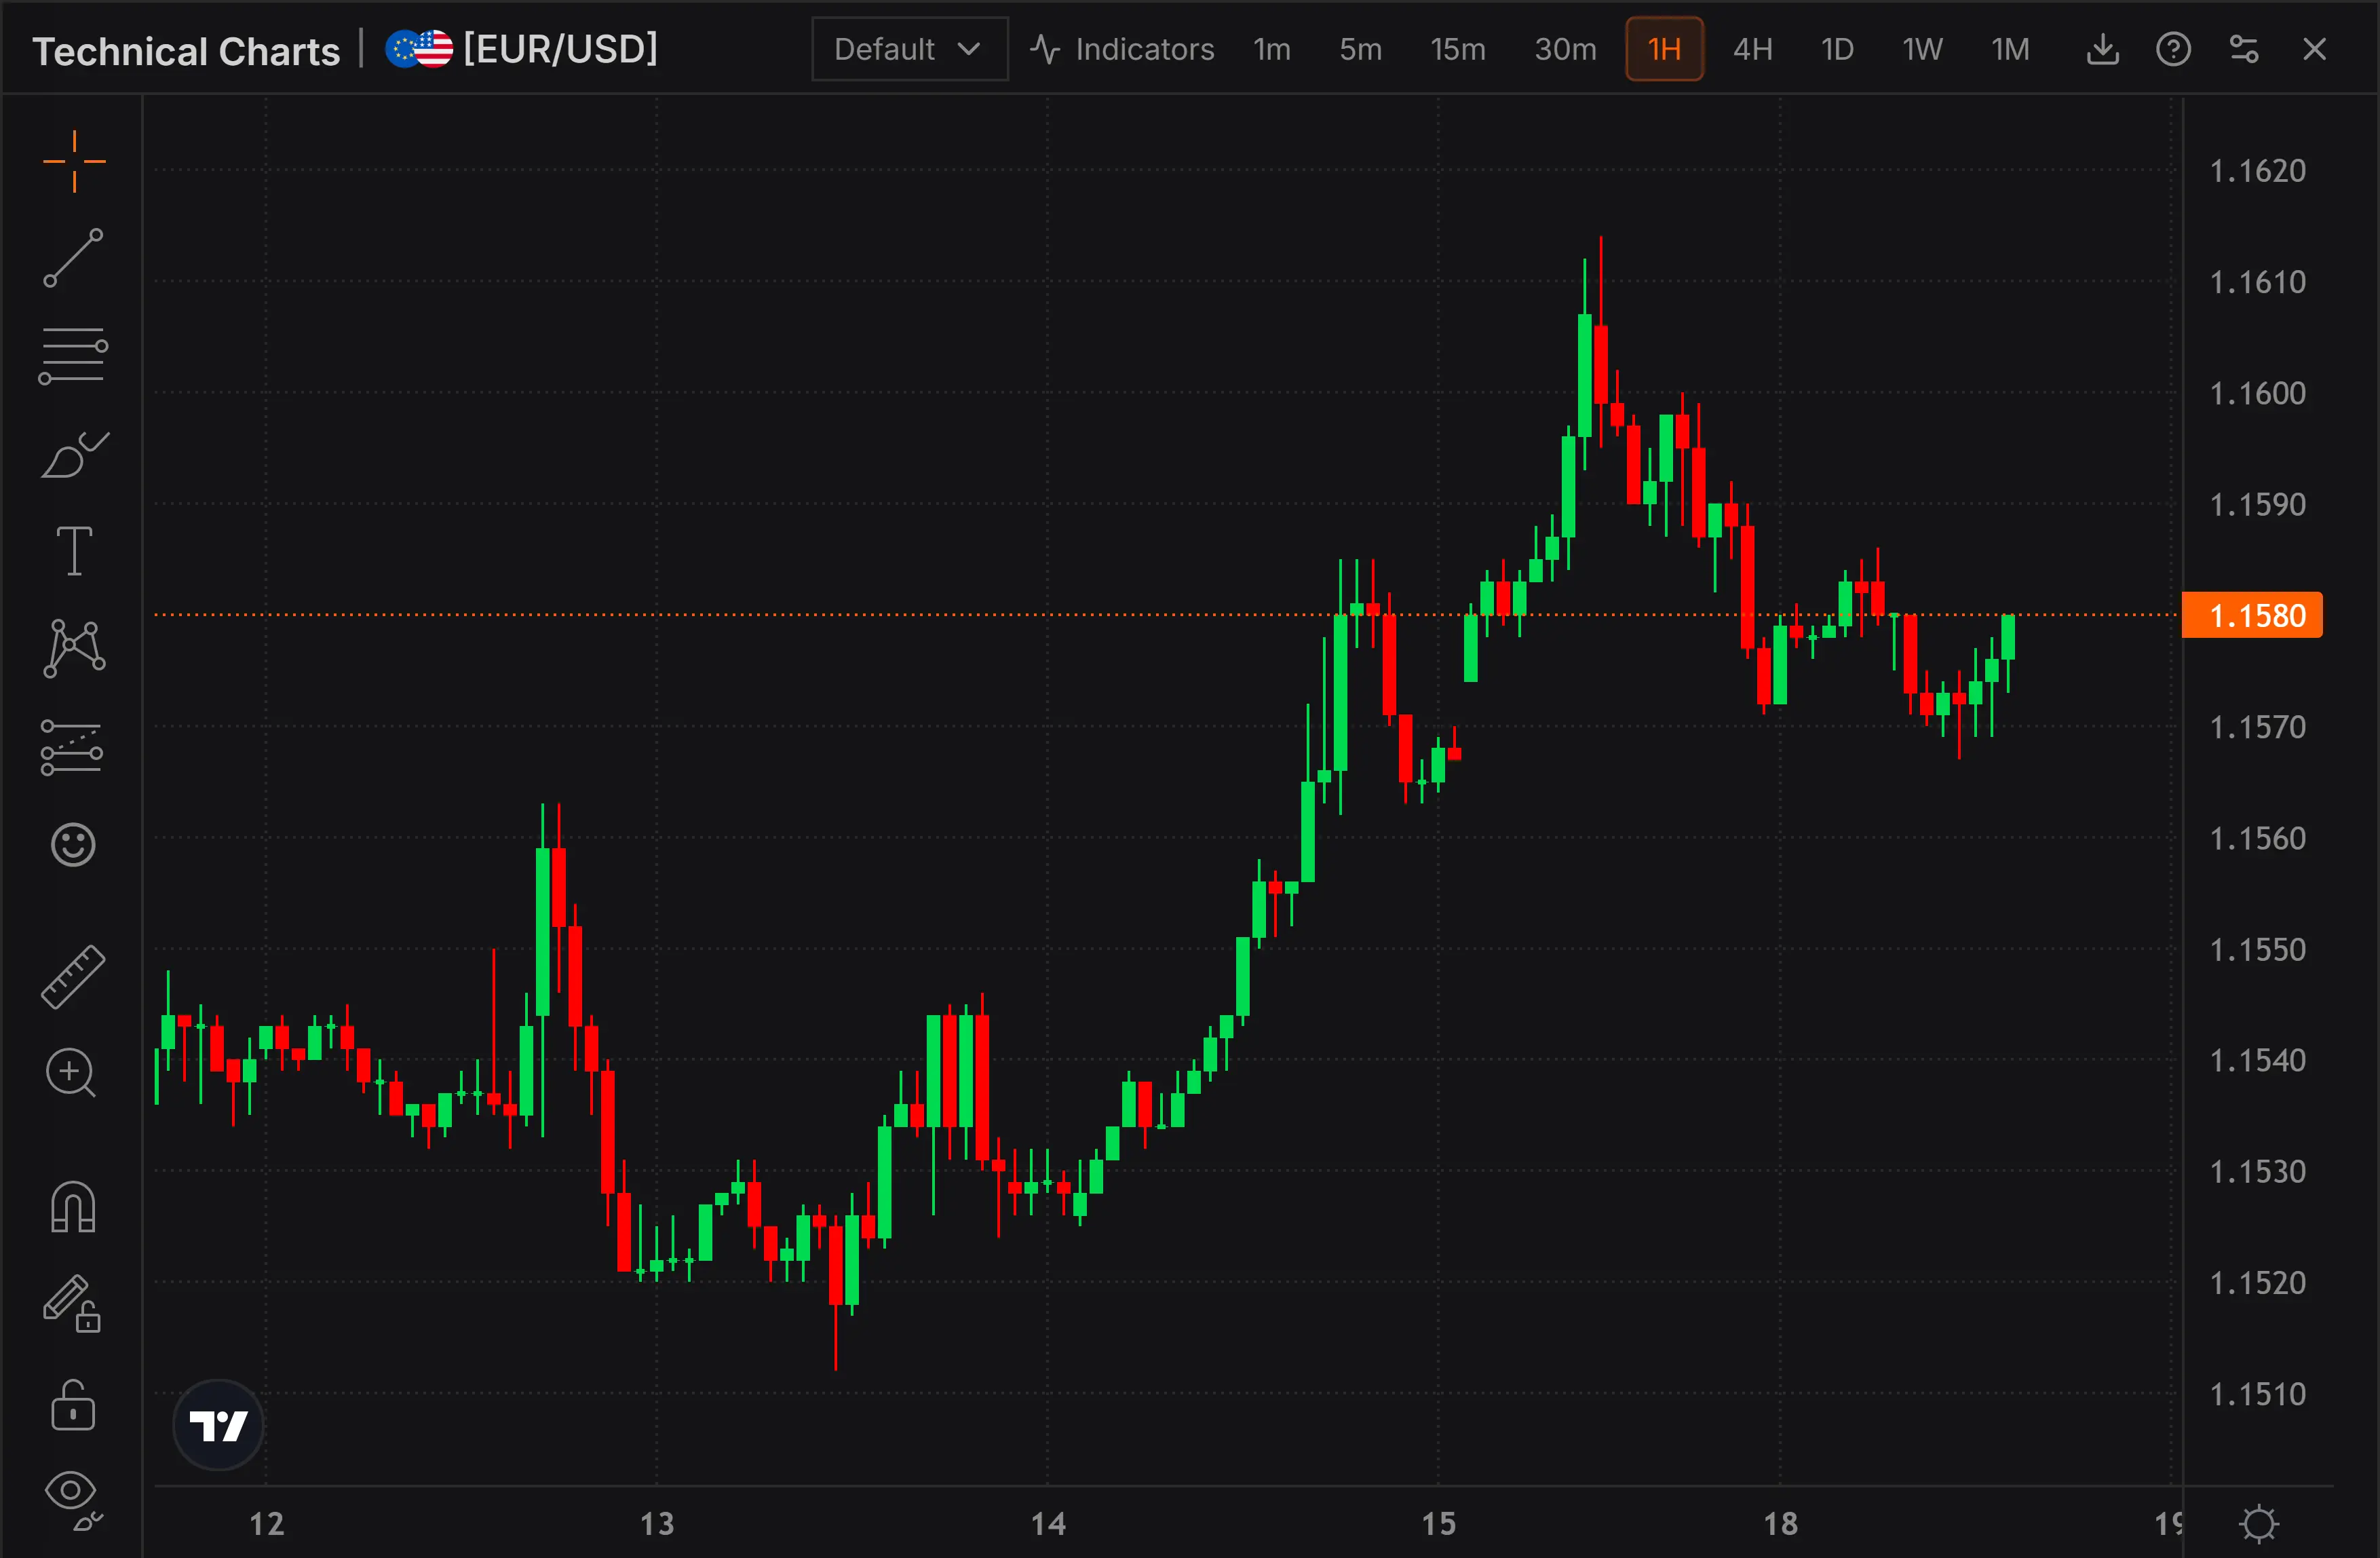
Technical Charts is the heavyweight. This is the chart you open when you want to do real technical work: draw levels, mark structure, run indicators and switch between timeframes.
What you get:
- Full drawing toolset: trendlines, horizontal levels, text, patterns, measurement tools and more, directly on the chart
- Indicators: add the technical indicators you need on top of price
- Timeframes from 1 minute to monthly: 1m, 5m, 15m, 30m, 1H, 4H, 1D, 1W, 1M
- 8 chart styles: Candlestick, Bars, Hollow Candle, Heikin Ashi, Line, Area, Baseline and HiLo
- Volume and OHLC values that you can toggle on or off in the settings
Use Technical Charts when you are building a trade idea, managing a position around key levels, or doing your weekend analysis.
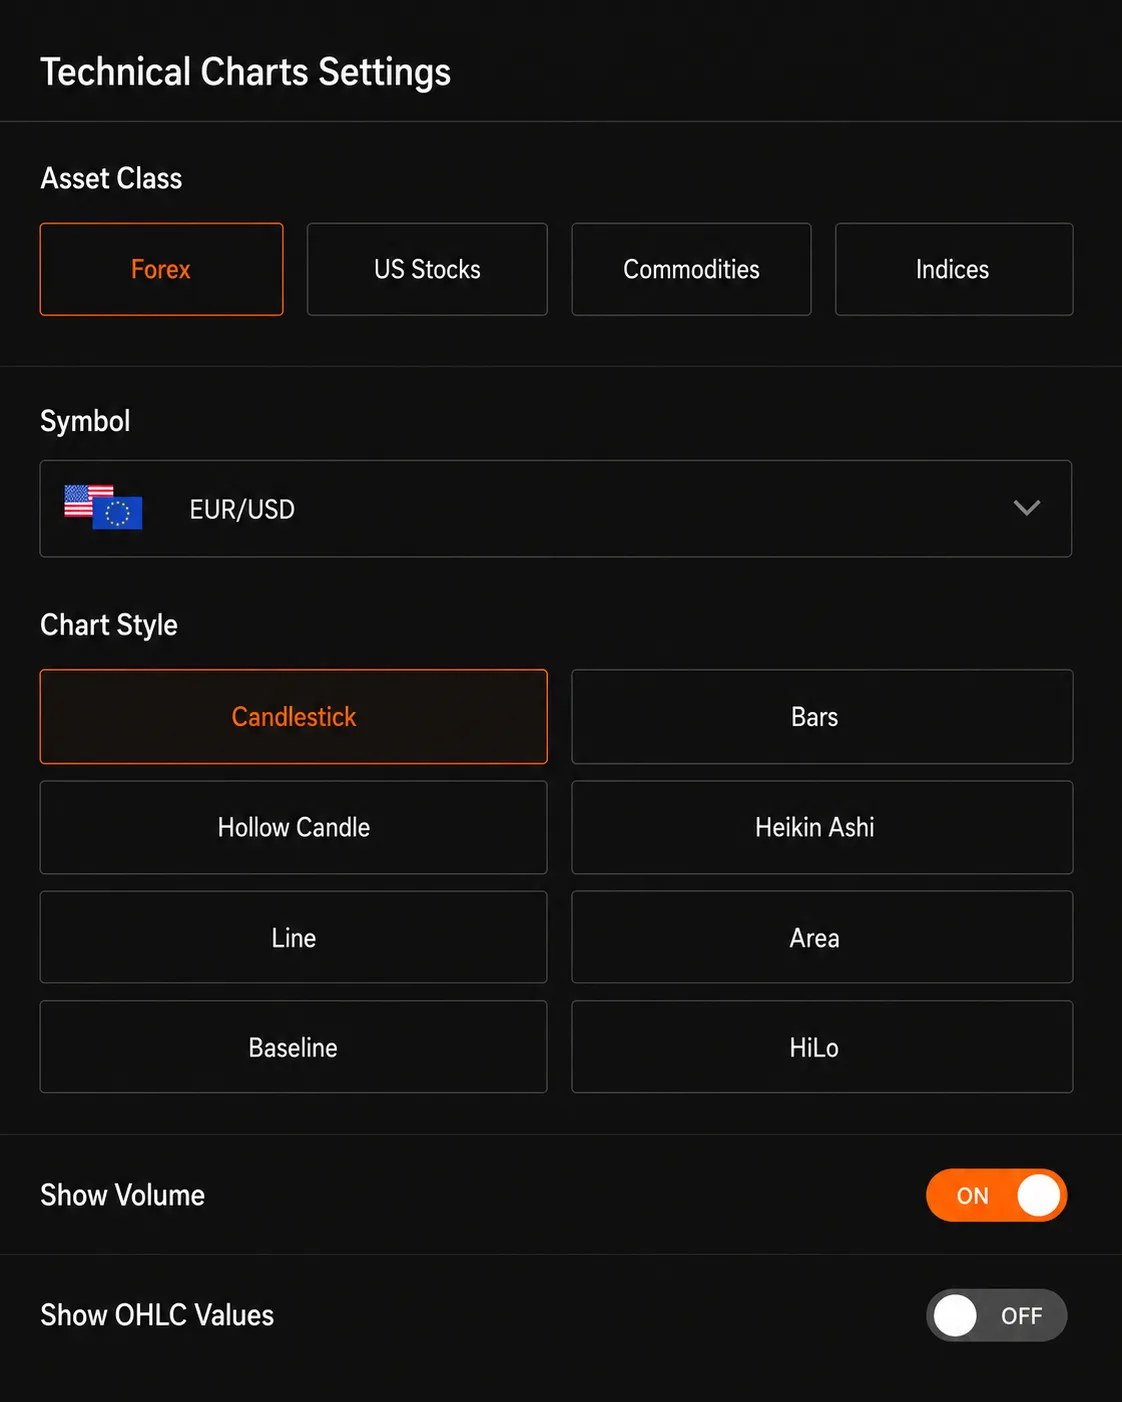
Configure the Chart Exactly How You Want It
Everything on the chart is controlled from one settings panel. At the top you pick your asset class: Forex, US Stocks, Commodities or Indices. Below that, the symbol search takes you to any instrument in 2 clicks. Then the chart style: 8 options from classic Candlestick and Bars to Heikin Ashi for smoothed trend reading, Line and Area for clean overviews, and Baseline and HiLo for specialized views. At the bottom, volume and OHLC values switch on or off with a toggle.
That is a lot of variety, but the panel keeps it flat and simple. No nested menus, no hidden tabs. Every option is visible on one screen, so you set up a chart in seconds and get back to the market.
Price Chart: Fast and Clean
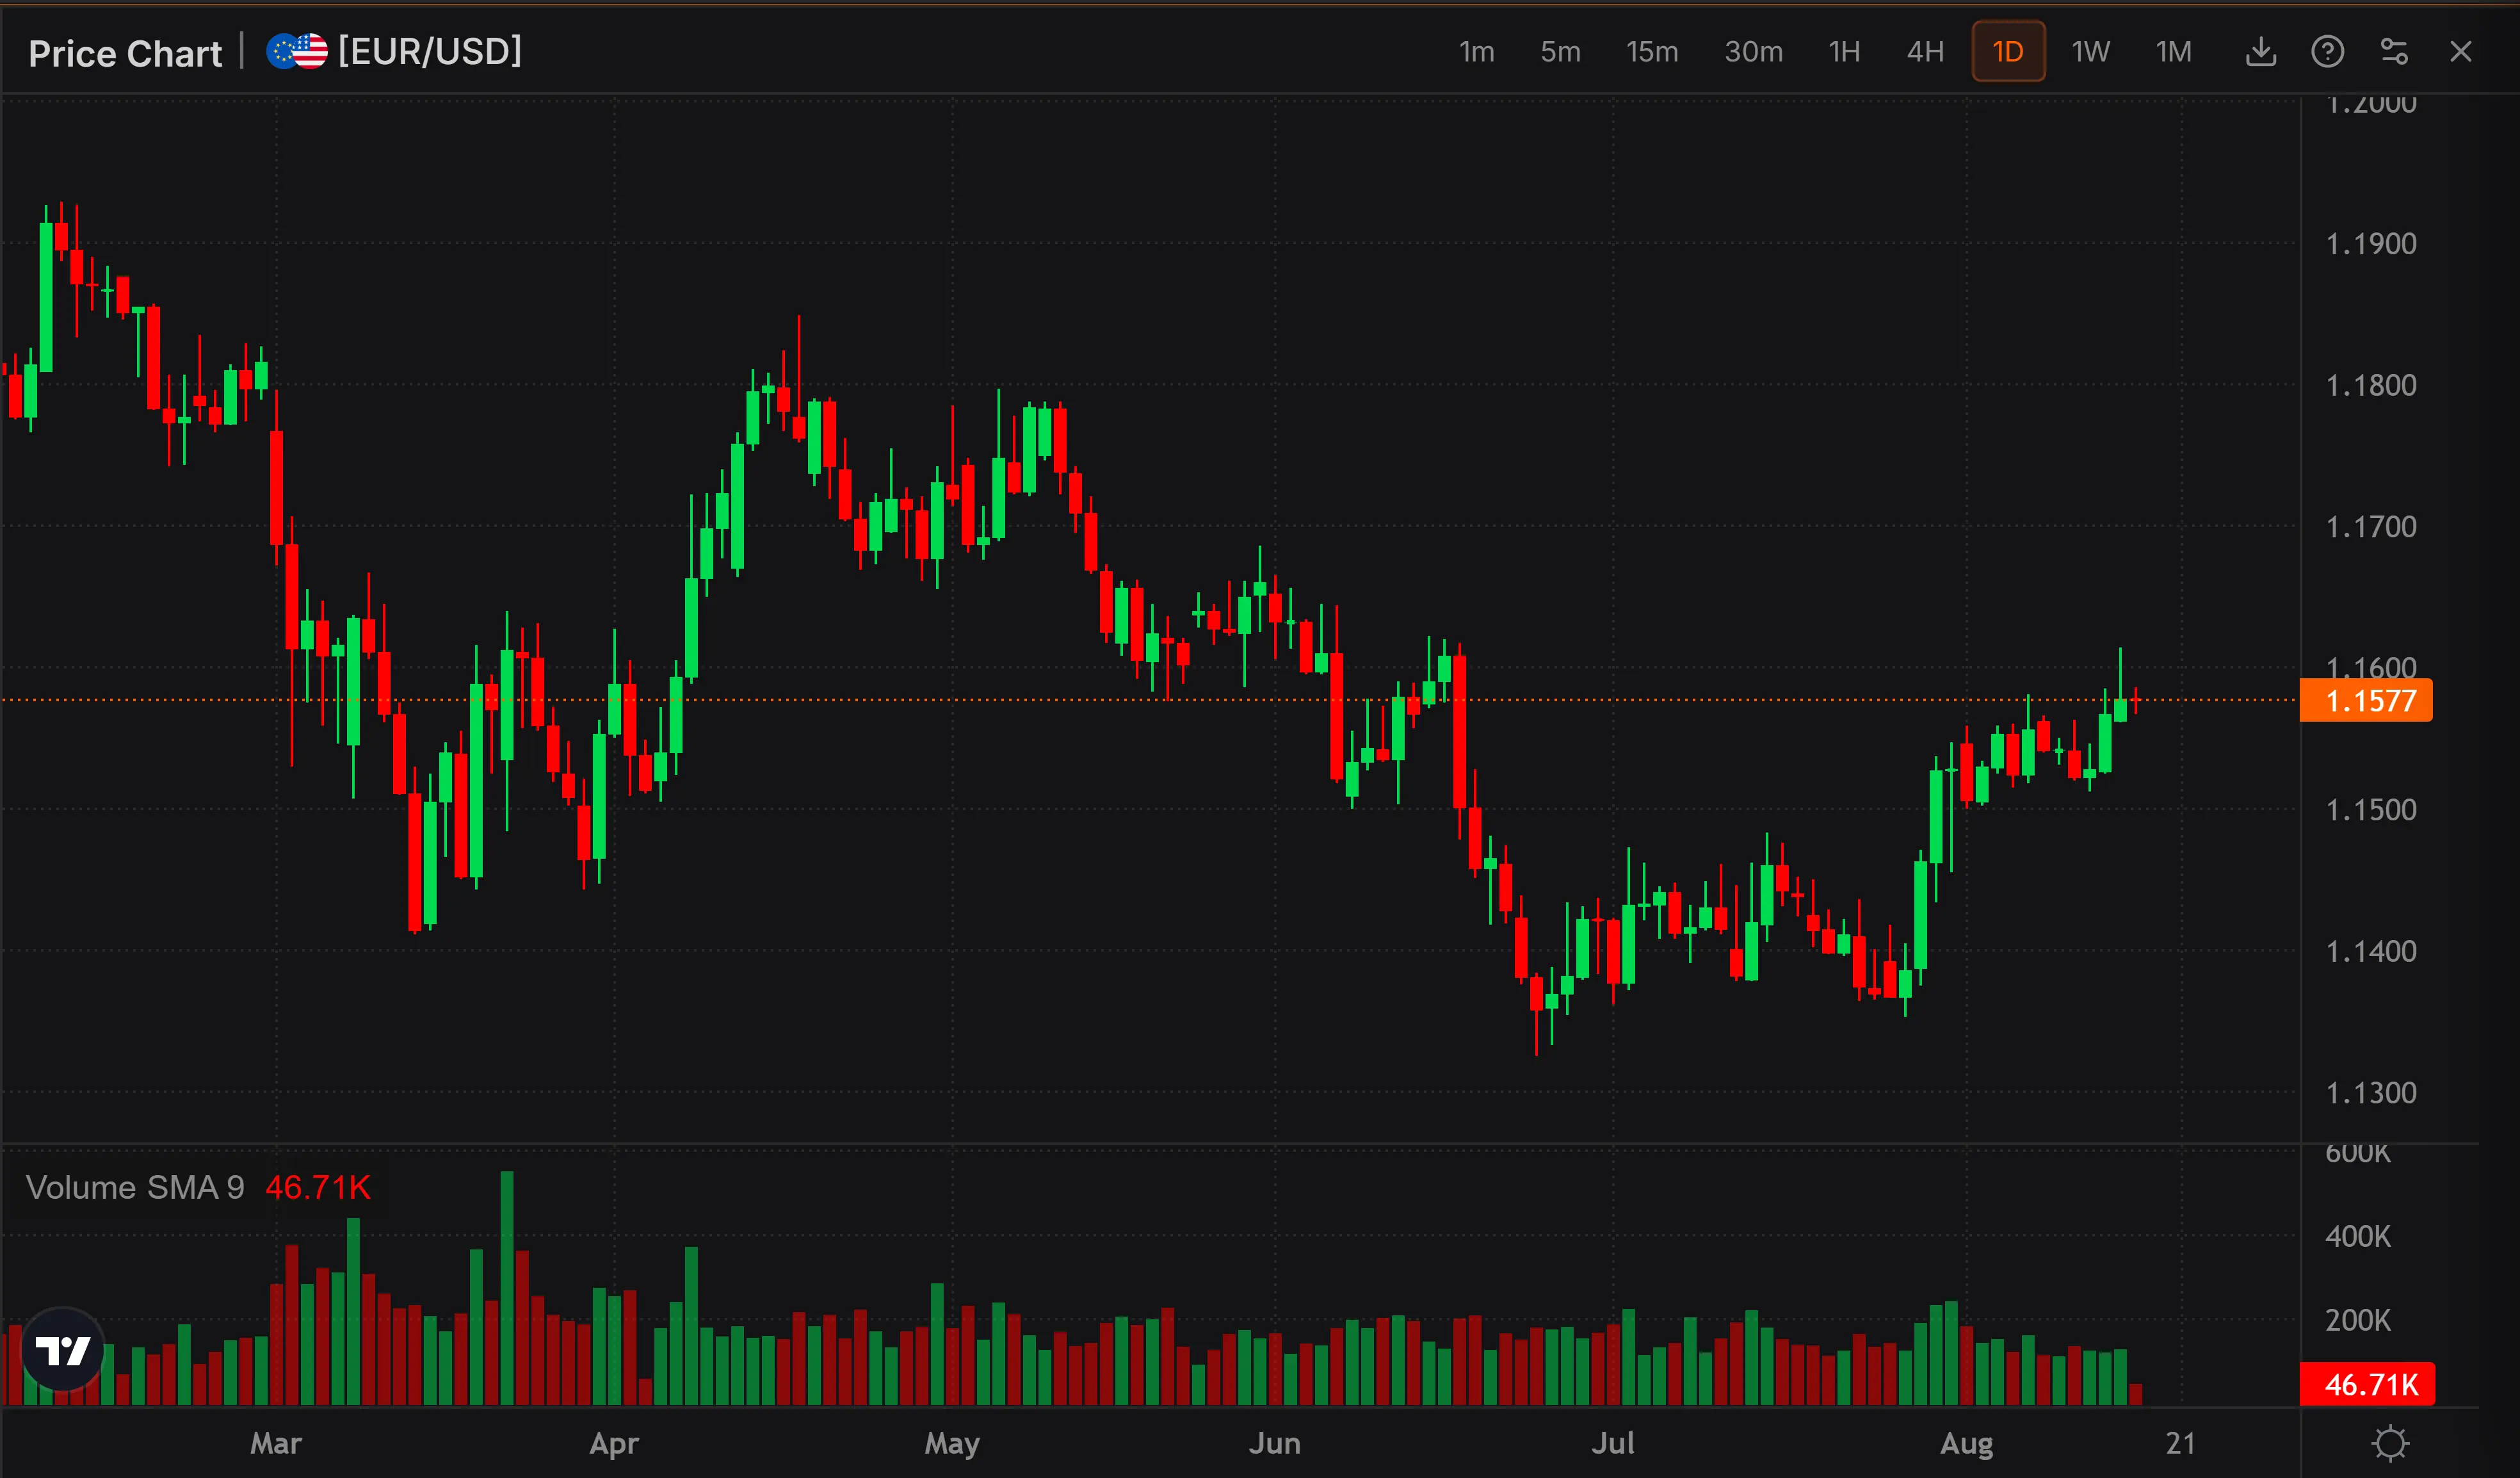
Price Chart is the lightweight version. No drawing tools, no clutter. Just price on the timeframe you choose.
That sounds like less, and it is. That is the point. When you build a multi-chart layout to monitor several markets at once, you do not need a full analysis suite on every single panel. You need clean price action that loads fast and reads instantly.
Typical use case: one Technical Charts widget as your main working chart, surrounded by several Price Chart widgets showing correlated markets. EURUSD as your main chart, with DXY, bond yields and gold running as clean price panels next to it.
Information Chart: Price Plus Market Context
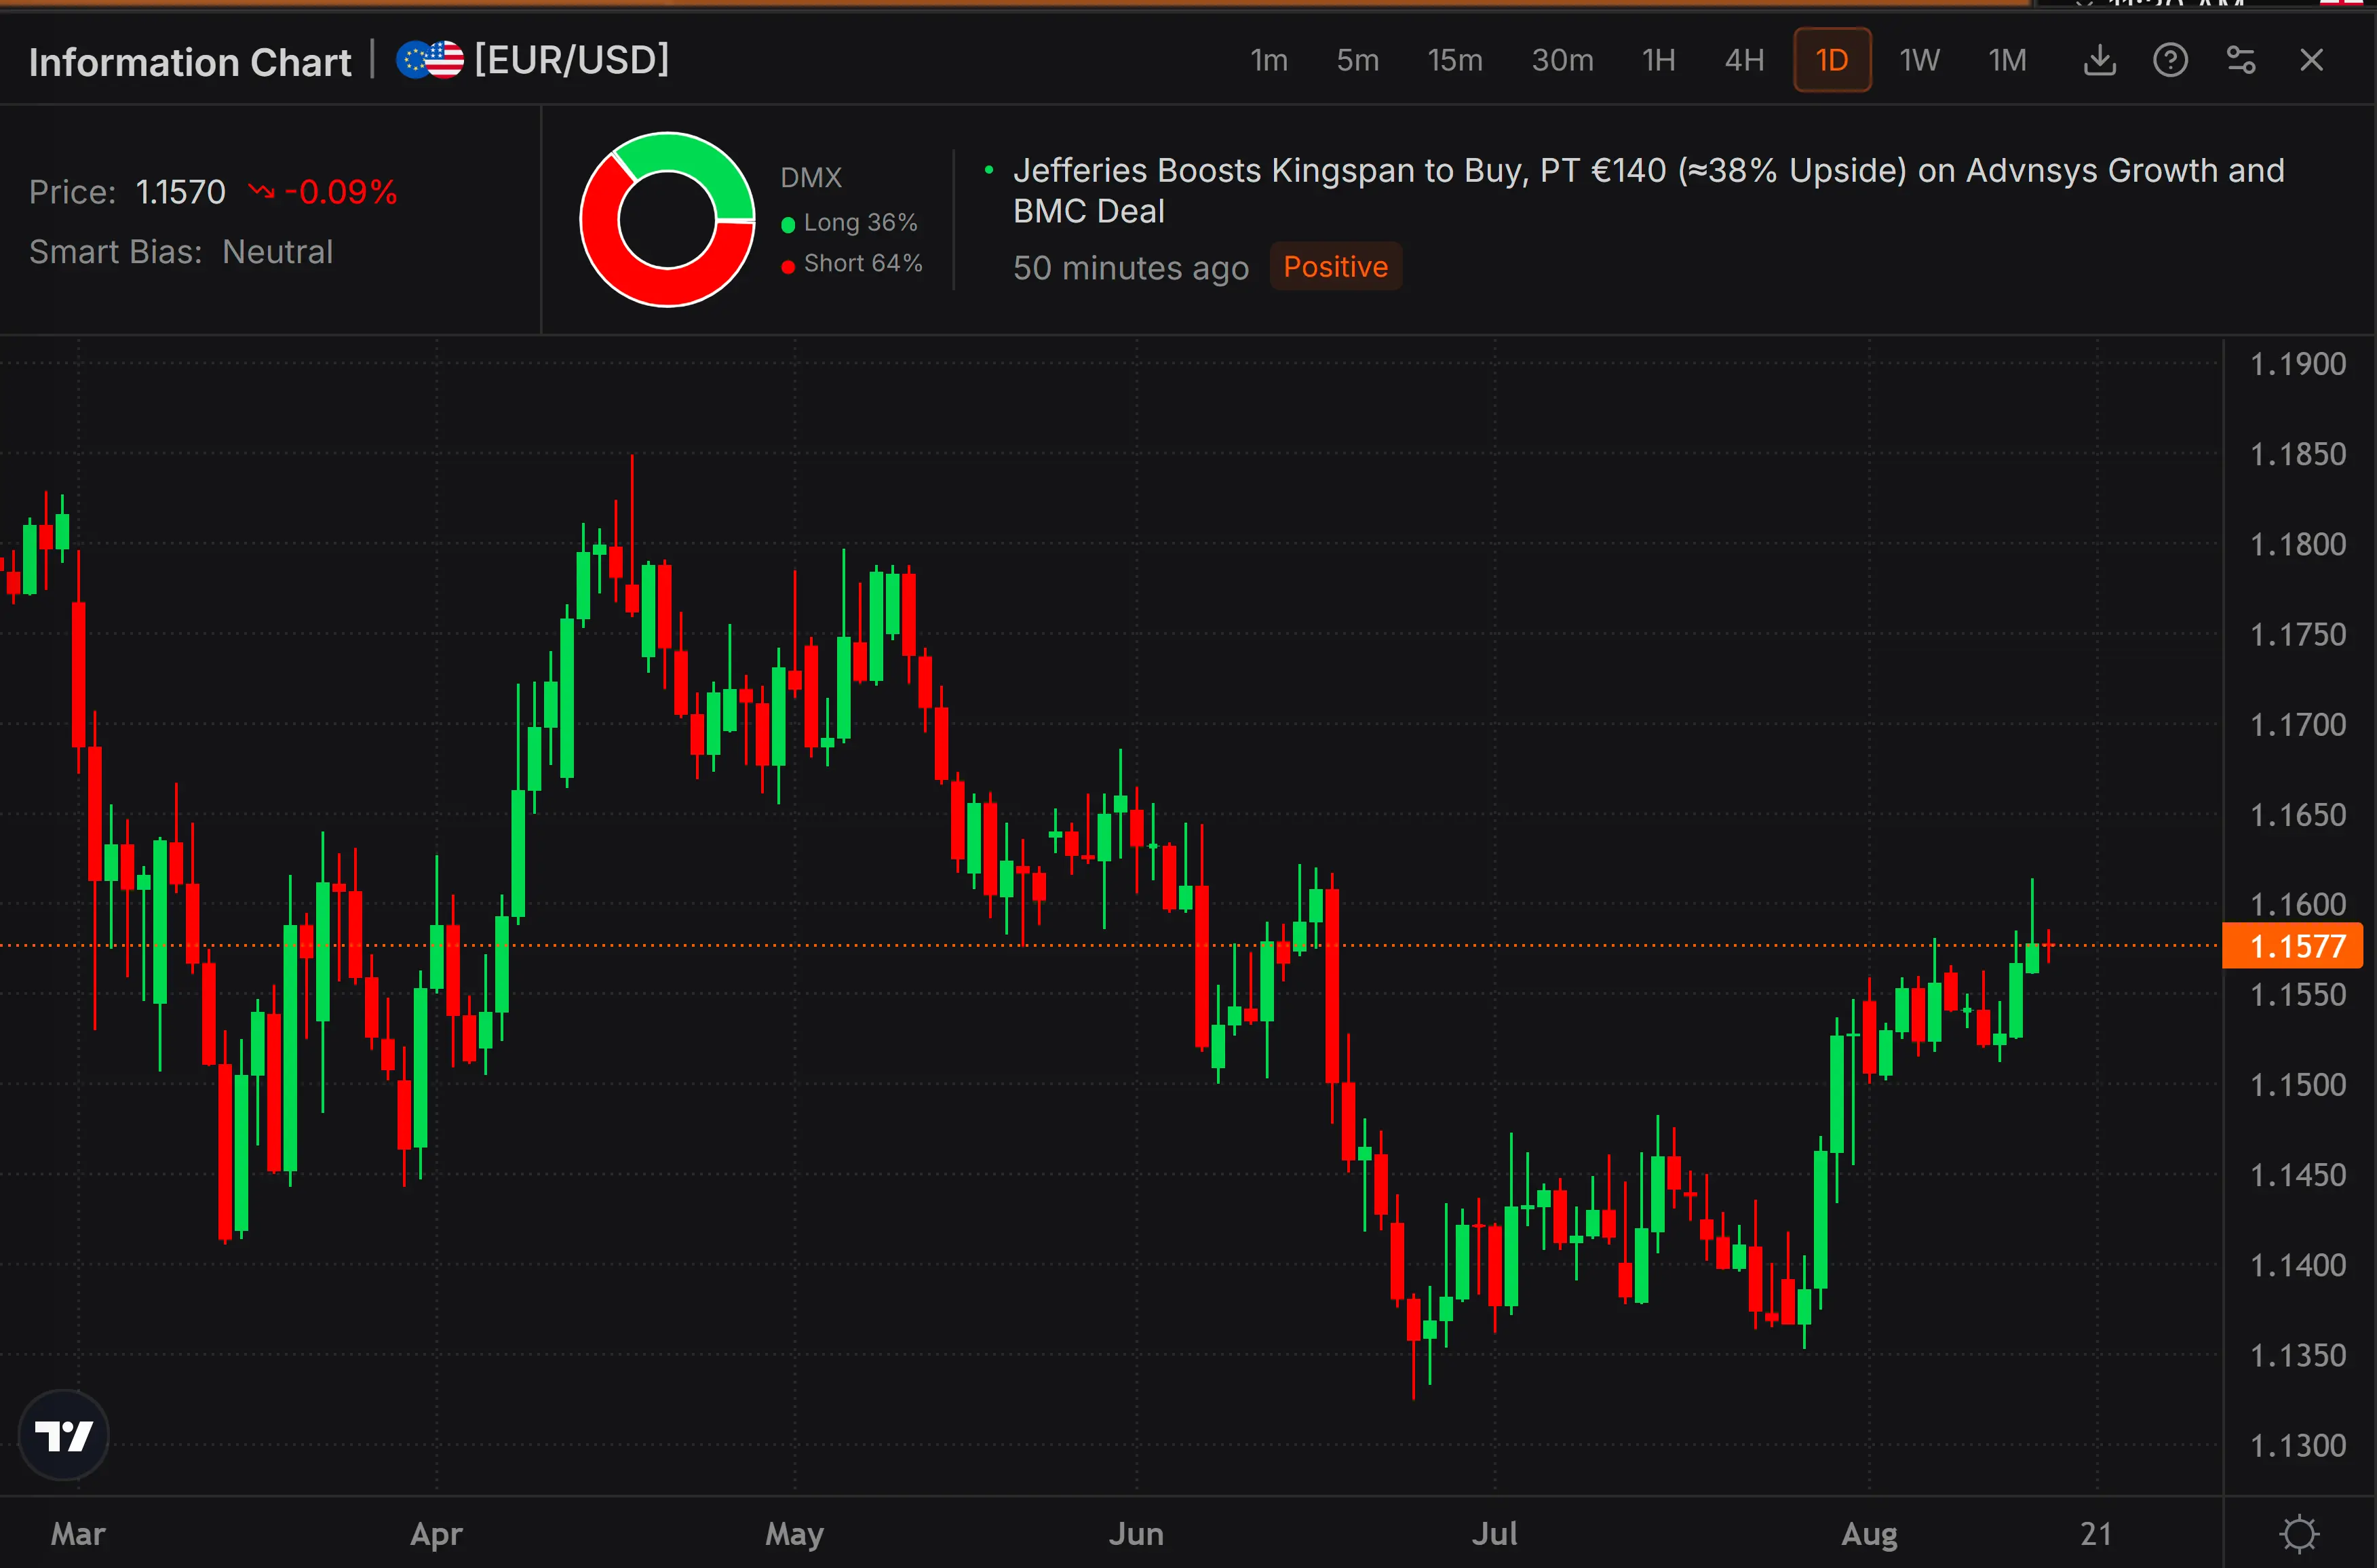
Information Chart is where this forex charting platform does something you will not find in a standard charting package. It combines the price chart with live context directly in the widget header:
- Current price and daily change
- Smart Bias: the terminal's directional bias for the instrument
- DMX (Dumb Money Index): live retail positioning showing what percentage of retail traders are long and short
- Latest headline: the most recent relevant news headline with a sentiment tag and timestamp
So instead of looking at a chart and then switching to 3 other tools to answer "why is this moving and who is positioned how", you see it in one view. Price, bias, retail positioning and the driving headline, together.
This matters because price action without context is just lines on a screen. A spike means something completely different depending on whether it came from a central bank headline, a data release, or nothing at all. Information Chart closes that gap.
Markets Covered
All 3 chart widgets cover the markets that matter:
- Forex: all major and cross pairs
- US Stocks: from large caps to your individual watchlist names
- Commodities: gold, silver, oil and more
- Indices: S&P 500, Nasdaq, Dow and global indices
- Single Currencies for tracking individual currency strength
Switching instruments takes 2 clicks in the settings panel.
Multi-Chart Layouts: Split, Stack, Save
Here is where the 3 chart types come together. Prime Terminal is not a single-chart application. You can open as many chart widgets as you want and arrange them in any configuration: 2x1, 2x2, 4x4, one big chart with a column of small ones, whatever fits your process and your screens.
A few examples of what traders actually build:
- The overview wall: a 4x4 grid of Price Charts covering every major FX pair at a glance
- The analysis desk: one large Technical Charts widget for the instrument you are trading, plus Information Charts for the markets that drive it
- The session monitor: Information Charts for your core pairs so you see price, bias, positioning and headlines for each one simultaneously
And you can save these configurations as templates. Build your layout once, save it, and load it every session. Build different templates for different jobs: one for the London open, one for US data releases, one for weekend analysis.
Why This Beats a Standalone Charting Tool
A standalone charting tool gives you charts. That is it. In Prime Terminal, your charts live next to 90+ other widgets: real-time news, an economic calendar, COT data, central bank forecasts, order flow, sentiment and institutional research. Your charting and your market context run in one terminal instead of 5 browser tabs.
The 3 chart types are the foundation of that. Full technical analysis when you need depth. Clean price panels when you need overview. Context-loaded charts when you need to know why the market is moving, not just that it is moving.
Try It Yourself
The fastest way to understand the difference between the 3 chart types is to open them side by side and build your first layout. Start your Prime Terminal trial and set up your charting desk in a few minutes.
Start free trialFAQ
What is the best charting platform for forex traders?
The best forex charting platform depends on how you trade, but the key features to look for are multiple timeframes, a full drawing toolset, flexible multi-chart layouts and, ideally, market context built into the chart itself. Prime Terminal combines all of these with over 90 additional market widgets in one terminal.
Can I view multiple forex charts at the same time in Prime Terminal?
Yes. You can open as many chart widgets as you want and arrange them in any grid: 2x2, 4x4 or any custom configuration. Layouts can be saved as templates and reloaded every session.
What chart types does Prime Terminal support?
8 chart styles: Candlestick, Bars, Hollow Candle, Heikin Ashi, Line, Area, Baseline and HiLo, on timeframes from 1 minute up to monthly.
Does Prime Terminal only cover forex?
No. The charts cover forex pairs, US stocks, commodities like gold and oil, indices like the S&P 500 and Nasdaq, and single currencies, all switchable inside the same widget.